VISITORS TO THE POWERHOUSE MUSEUM IN 2015 – 2015

WESTIR requested data on visitor numbers from the Powerhouse Museum. Not all visitors to the Powerhouse supply their postcode so it was not possible to obtain a full listing of all visitors. In 2015 out of a total of 470,000 visits, postcodes were available for only 203,000 visits. There were also system changes which resulted in anomalies in the raw data. These were were adjusted by substituting average values from previous years for 11 postcode areas. The file provided to WESTIR includes only those visitors to the Powerhouse with a NSW postcode, a total 160,275 visitors. This represents approximately 34% of total visitor numbers to the Powerhouse in 2015. These figures are indicative rather than definitive.
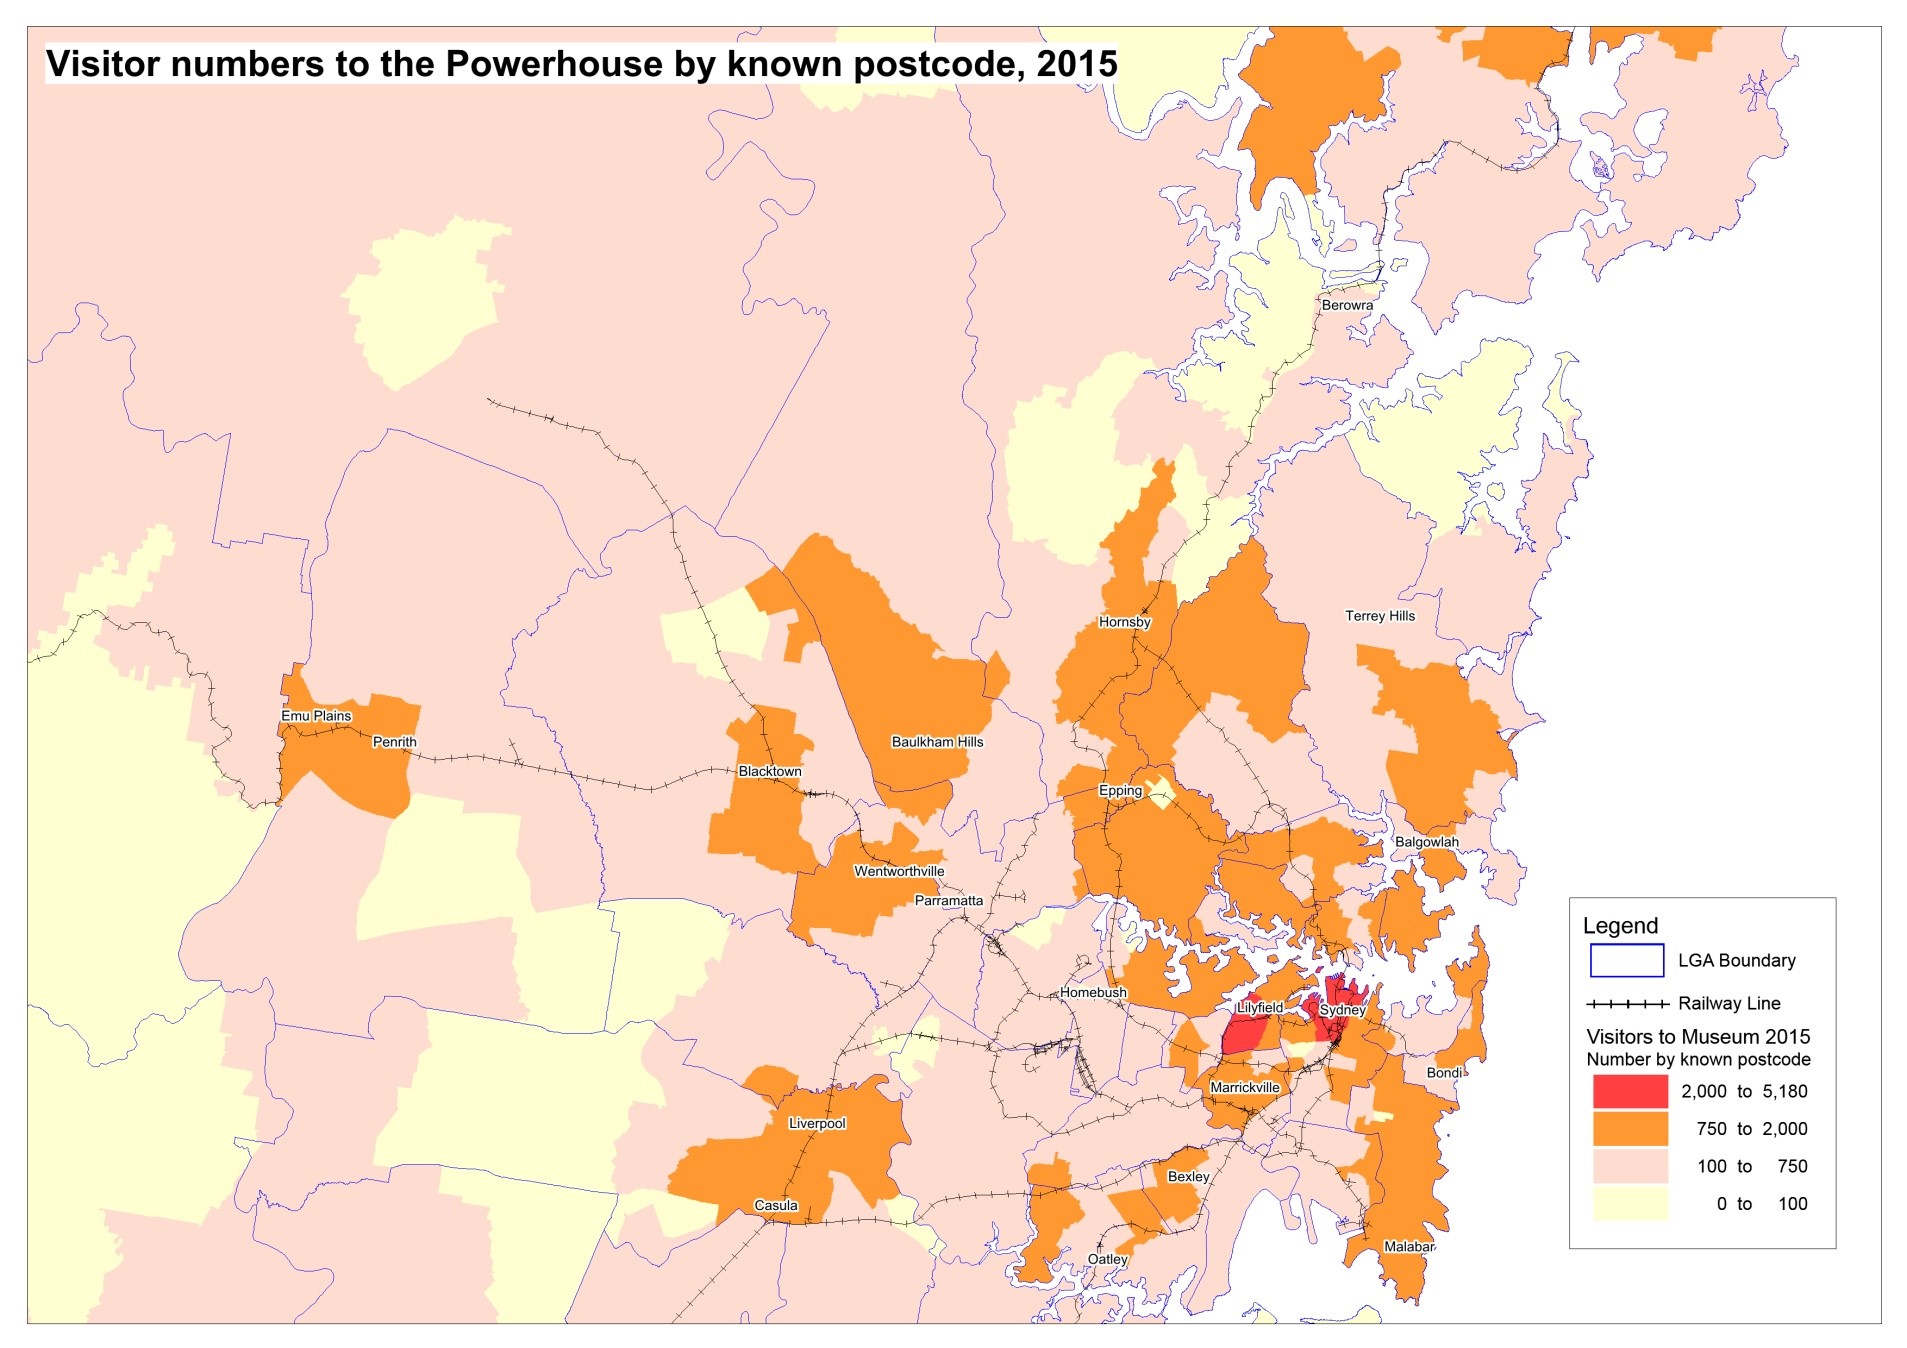
WESTIR has then used these figures to map visitor numbers by postcode in order to determine which areas produce the greatest number of visitors. Map 1 clearly shows the highest numbers to be from postcode areas around Sydney City and Leichhardt. The highest number of people came from Postcode 2000 Darling Harbour (5,164 visitors) followed by Postcode 2007 Broadway (2,875 visitors), Postcode 2040 Leichhardt (2,217 visitors) and Postcode 2009 Blackwattle Bay (2,144 visitors). It could be assumed that Darling Harbour and Broadway visitors could be tourists staying in CBD Hotels. A further pattern identified in Map 1 was the cluster of higher visitor numbers coming from postcode areas accessible to the city by direct rail, postcode areas with Ferry links to the CBD or as in the case of the eastern suburbs, direct and frequent bus services.
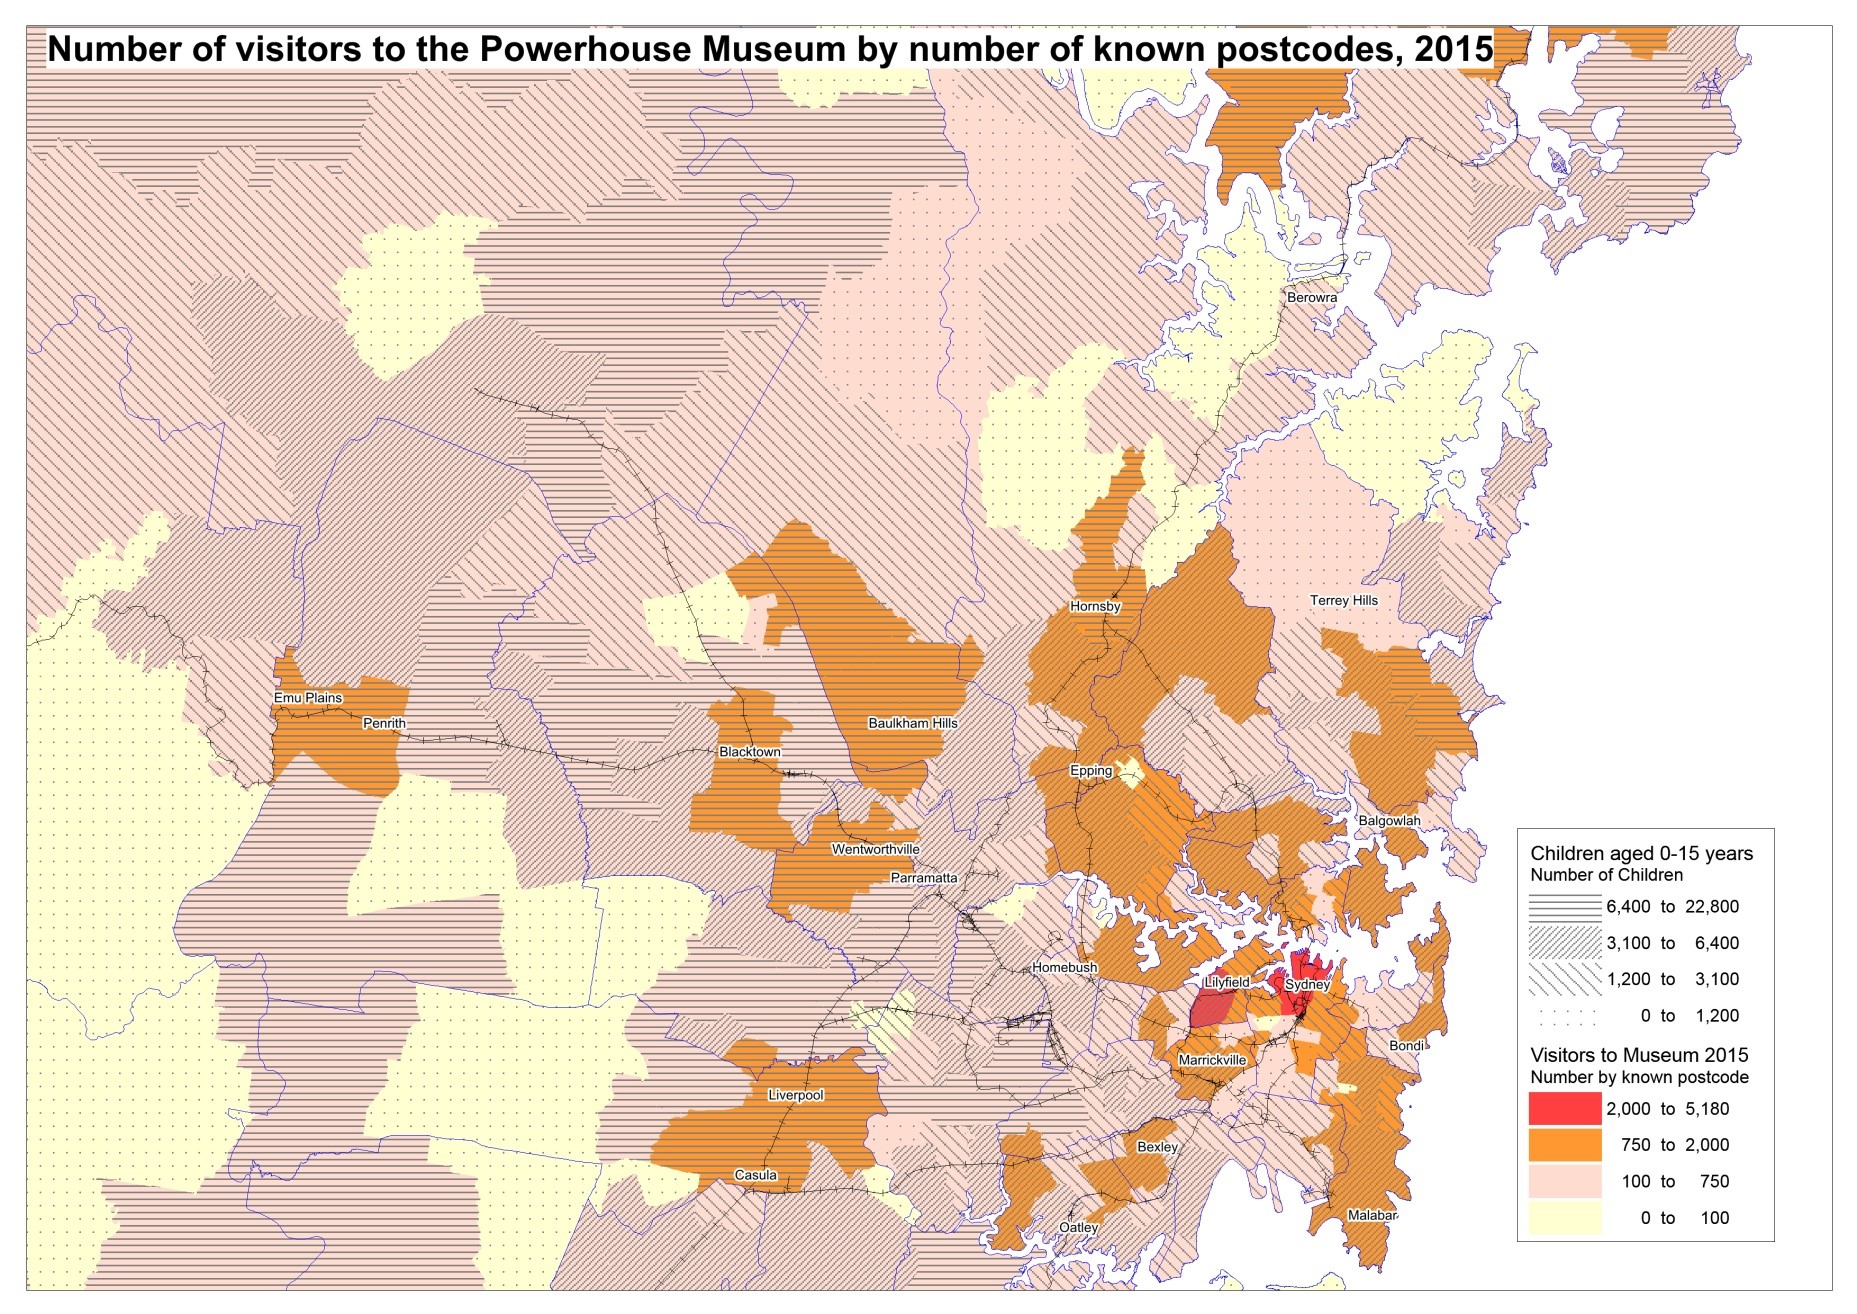
Map 2 is a bit more complicated. Here, a second layer showing the number of children in each postcode in the 2011 Census has been used to overlay visitor numbers. This results in a further pattern being revealed. Higher visitor numbers are not only related to proximity of tourist accommodation and transport links, but also to the number of children living in each area. Map 2 clearly shows higher numbers of children in the majority of postcodes with high visitor numbers.
WESTIR’s interest in visitor numbers was generated by recent discussions regarding relocating the Powerhouse from Ultimo to Parramatta. As proud Westies we have no problem with a Powerhouse Museum being at Parramatta but we do think that these maps, although they use indicative figures, provide an argument for having two Powerhouse Museums, one at the current location and one at Parramatta.
Map 1: Number of visitors to the Powerhouse, 2015
Source: Powerhouse Museum, 2016
Map 2: Number of visitors overlaid by number of children, 2015
Source: Powerhouse Museum, 2016 and ABS Census 2011
OUR CENSUS
WESTIR Limited analyses data from the Australian Census Report of Population and Housing for Greater Western Sydney.
OUR NEWSLETTERS
Explore our past newsletters, looking at WESTIR’s research and activities.